
Market profile analysis often reveals the underlying auction process of markets—where price is accepted, where it is rejected, and where future opportunity may develop. When we step back and examine the structure from 2021 through 2026, a clear narrative emerges about balance, breakout, and the market’s ongoing search for value.
2021 to 2023
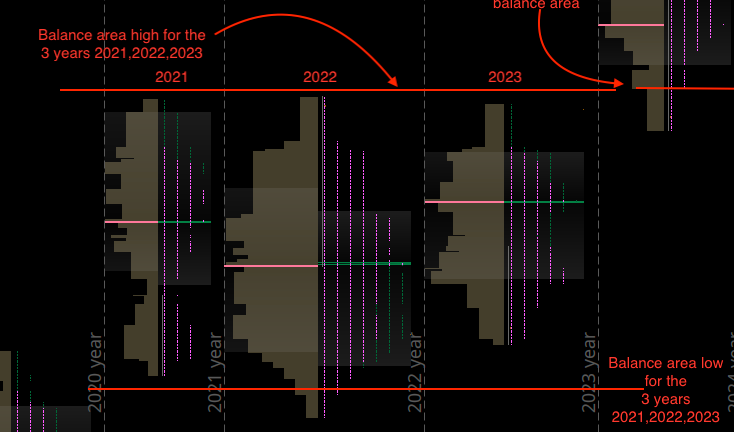
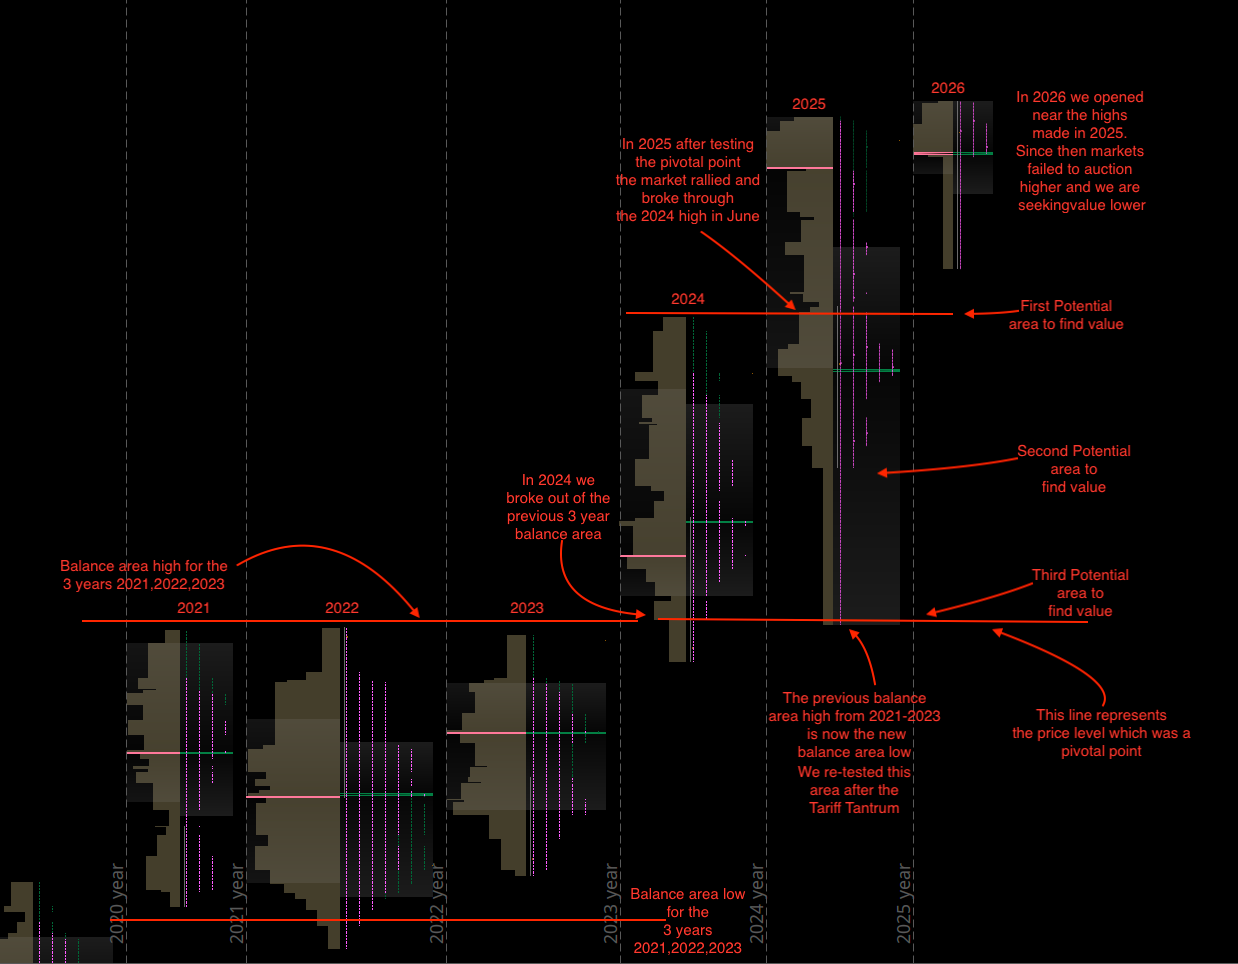
Between 2021 and 2023, the market spent a prolonged period rotating within a well-defined balance area. The profile distributions during these three years show repeated acceptance of price within a relatively stable range. The balance high formed near the upper region around the low 500s, while the balance low developed closer to the upper 300s, roughly near 398. This multi-year structure is important because long periods of balance tend to build significant inventory and interest. When markets eventually leave these zones, the resulting moves can be powerful and directional.
During this period, price consistently returned to the middle of the range, suggesting that participants were comfortable transacting there. The repeated rotations created a clear framework: value had been established, and the market had not yet discovered a reason to trend strongly in either direction. Market profile teaches us that balance precedes imbalance, and the longer the balance lasts, the more meaningful the eventual breakout becomes.
2024 Breakout
That breakout arrived in 2024.
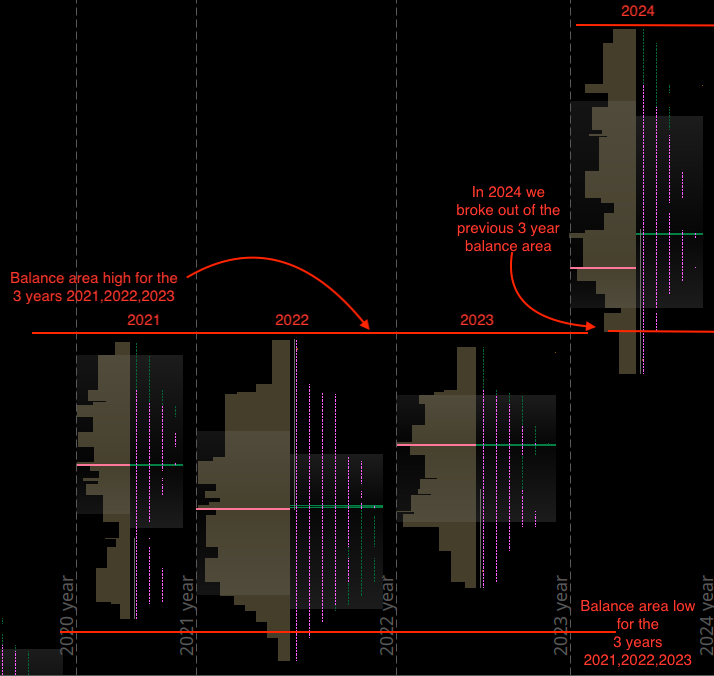
In 2024, the market moved above the previous three-year balance high. This was a structural shift in the auction process. Once price moved beyond that upper boundary—roughly around the 470 - 500 region that had previously capped rallies—the market signaled that it was seeking higher value. Breakouts from long-term balance areas often attract momentum and participation because investors recognize that a major reference point has been exceeded.
The profile distributions in 2024 show how the market began to build new value higher than the previous range. Instead of rotating back into the old balance immediately, the market started to accept prices above it. This is one of the key principles of market profile: when price leaves a balance area and is accepted above it, the previous balance high often transforms into support.
In other words, what was once resistance becomes a new structural floor for the market.