
1. Equity Index Profiles (SPY & QQQ)
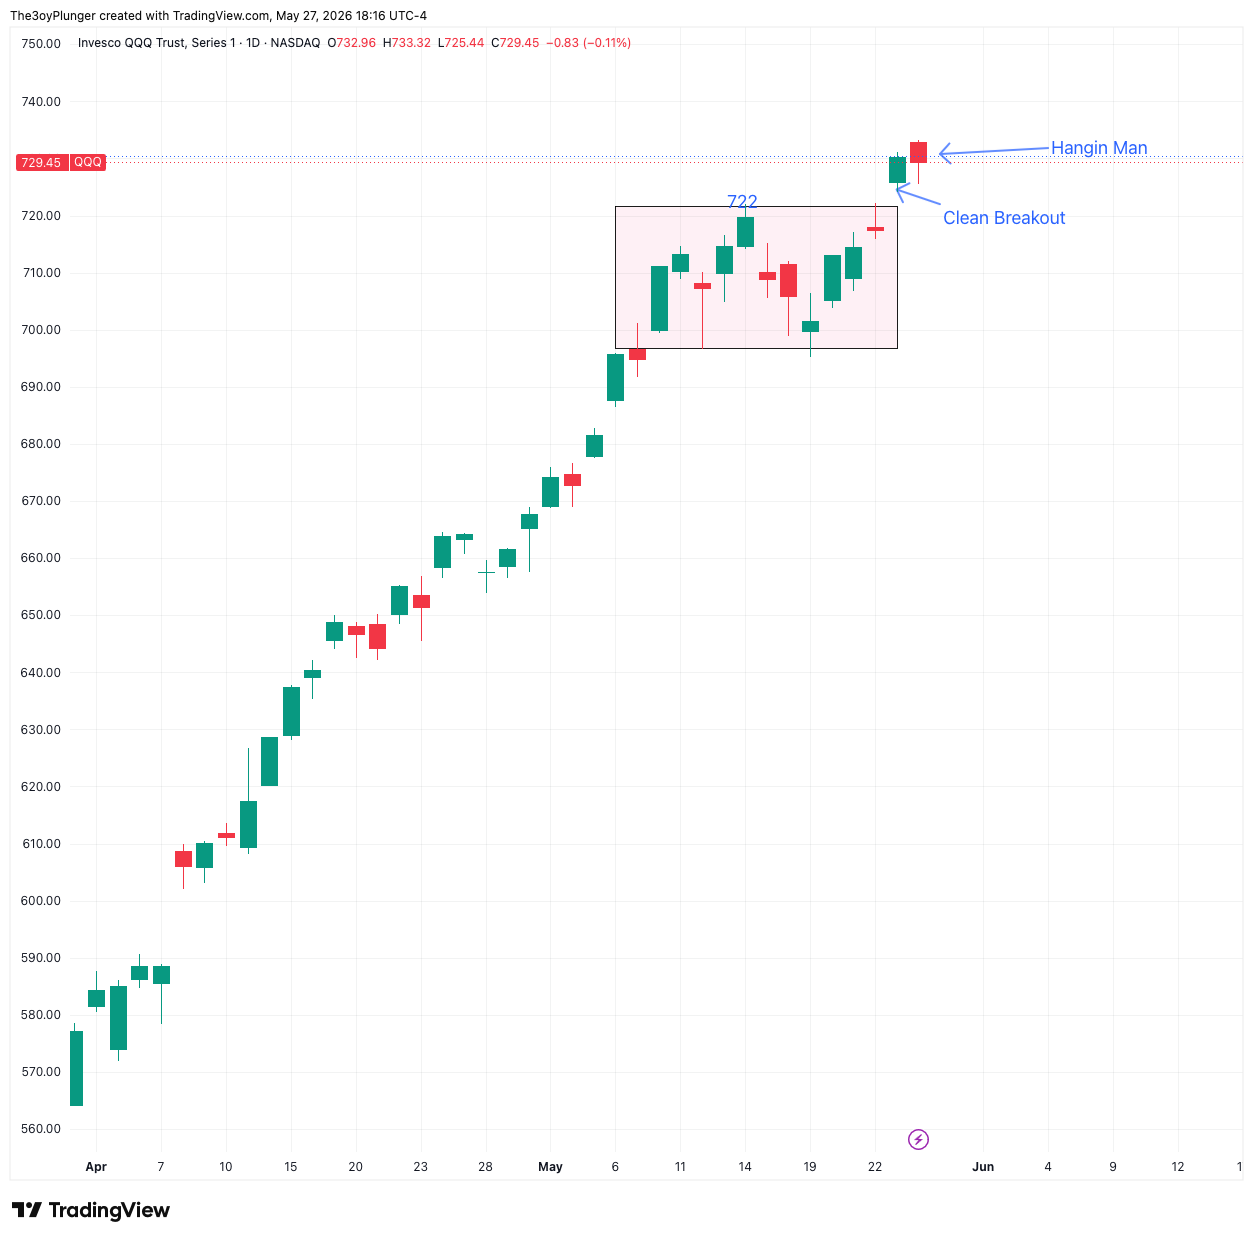
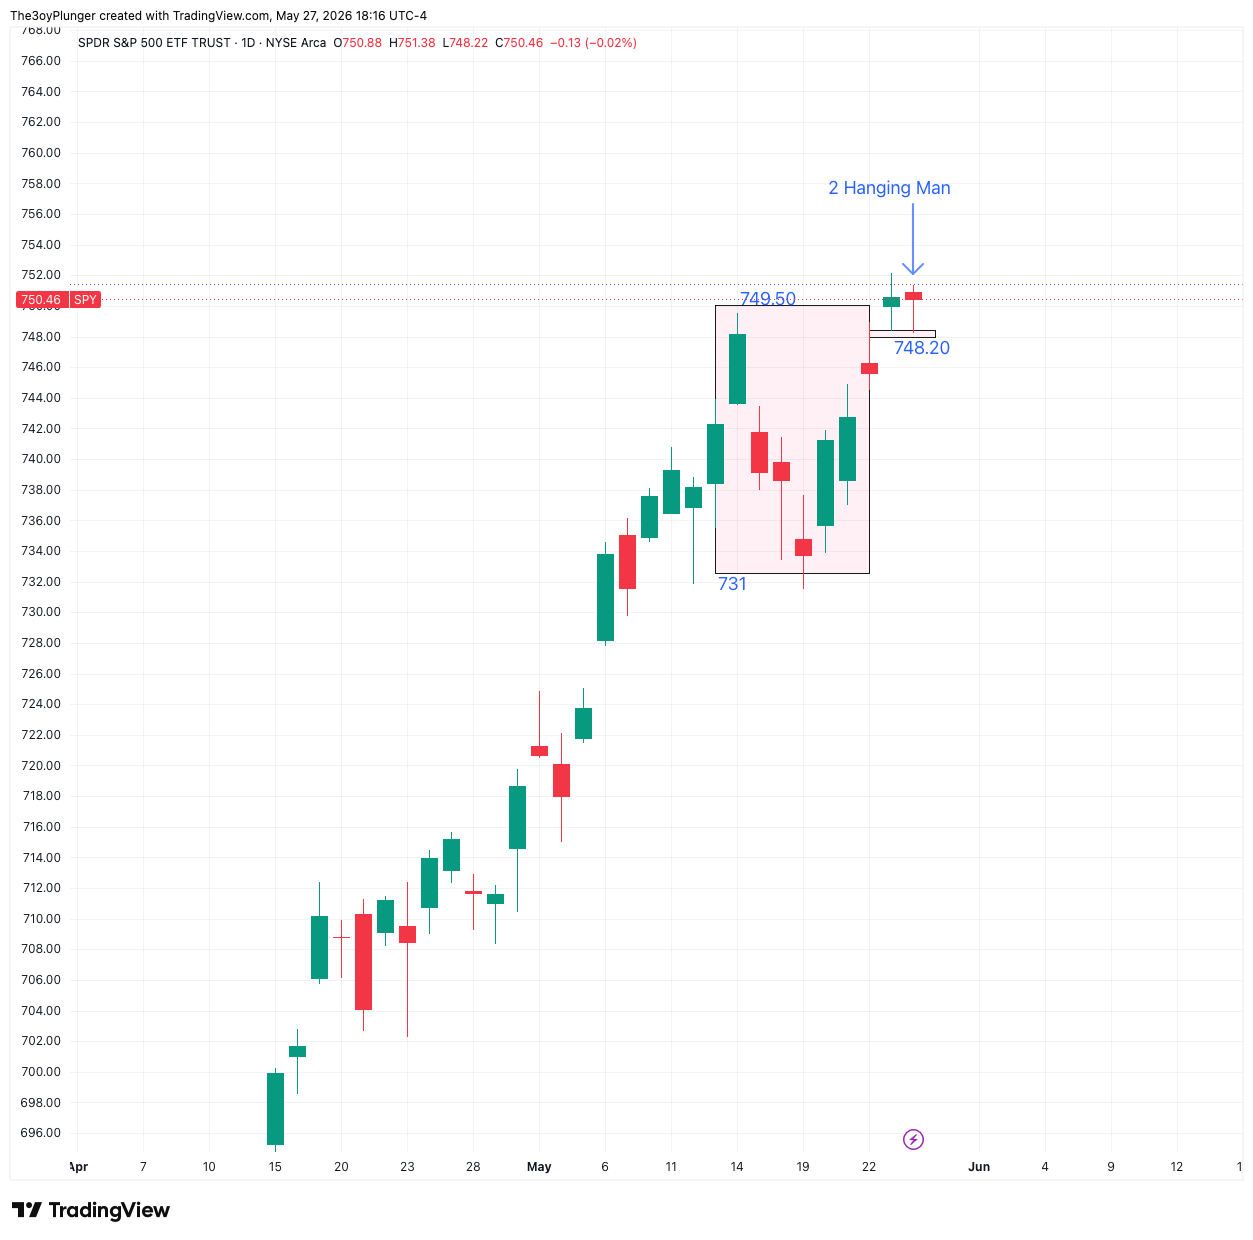
Following yesterday's breakout attempts, the broad market encountered some distribution during the May 27 AM session. The QQQ in particular suffered a stark intraday reversal, printing an exhaustive look-above-and-fail structural pattern, however buyers stepped in the afternoon session.
As noted in our mid-day portfolio update, the price action across the board today was strictly flashing yellow. From an auction theory perspective, a single day of aggressive selling does not automatically guarantee a structural trend collapse. We do not predict market direction; instead, we monitor for confirmation.
Going into tomorrow's opening bell, the validation matrix is straightforward: if we see the indexes gap lower and sustain a continuation of today's lower prices, it will formally confirm that today's distribution was institutional liquidation rather than a healthy backtest. If the market instead balances within today's range, the broader bullish structure remains intact but paused.
2. Alpha Names (Tech Hardware Reversal Auctions)
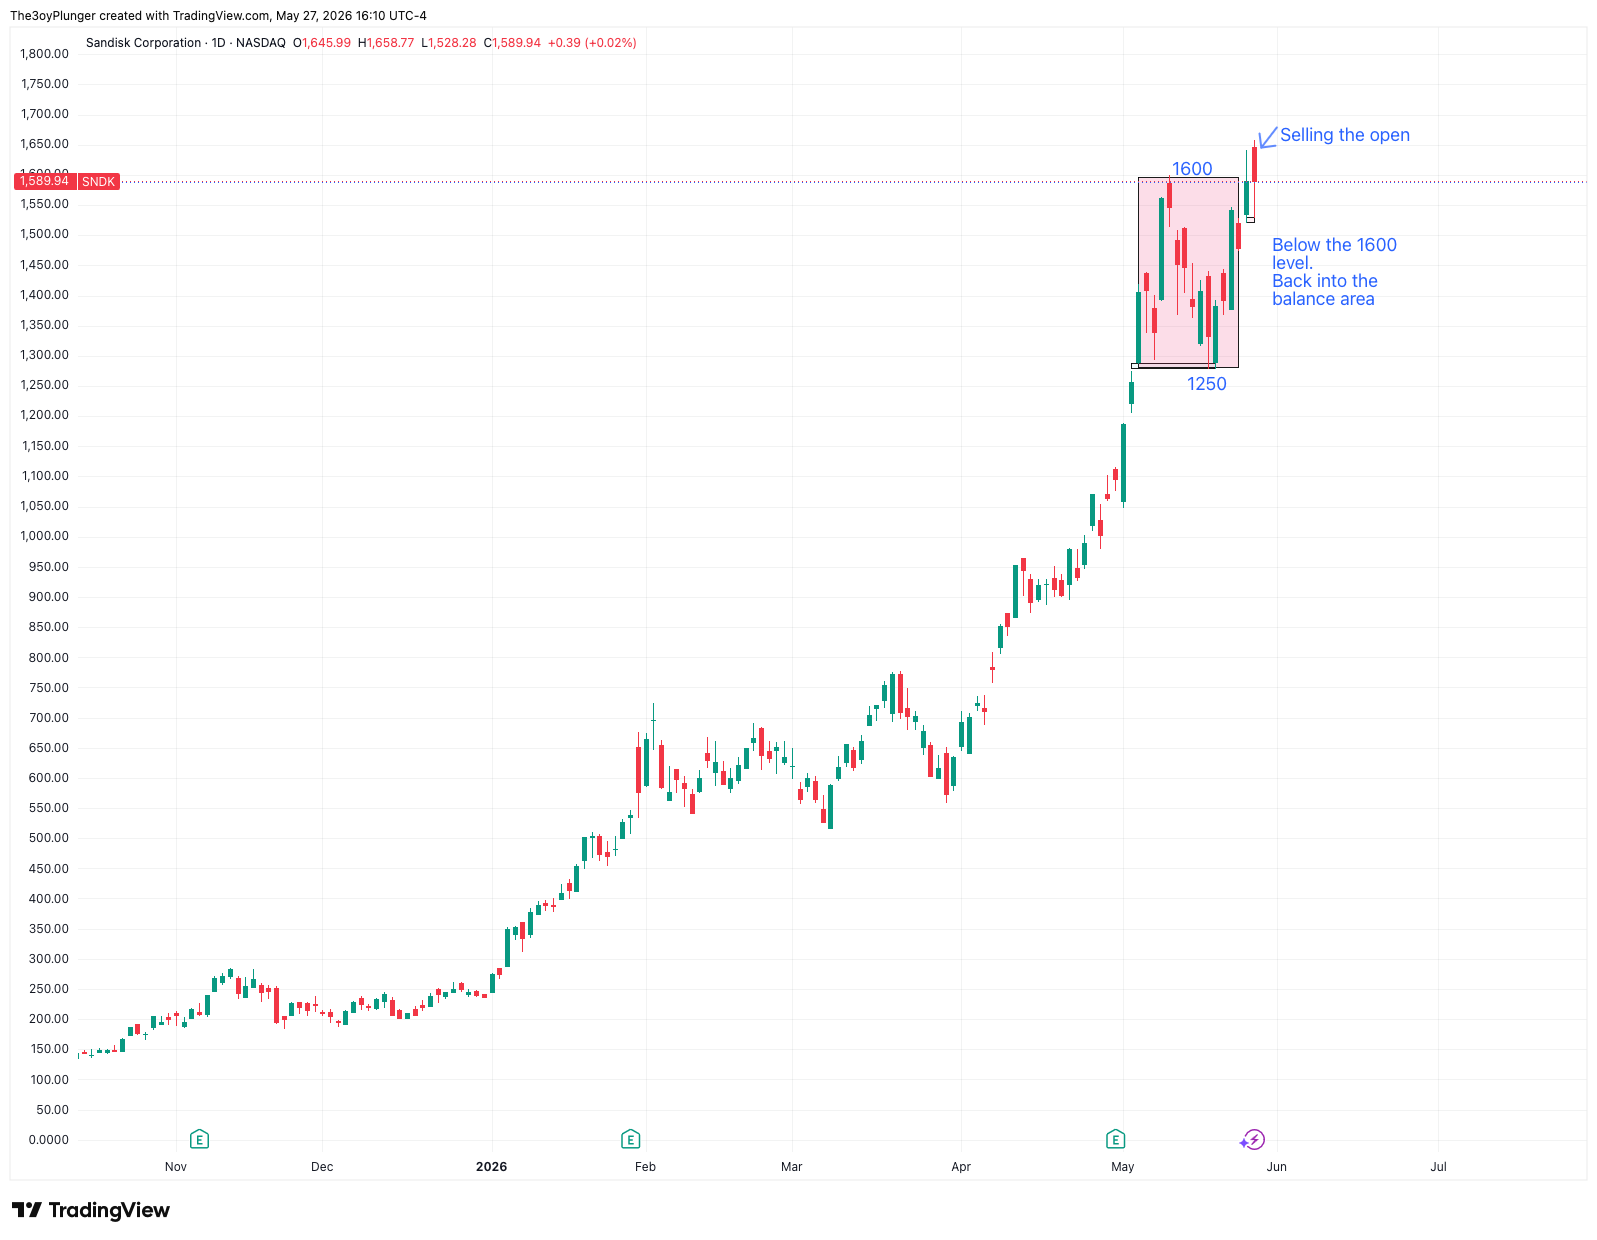
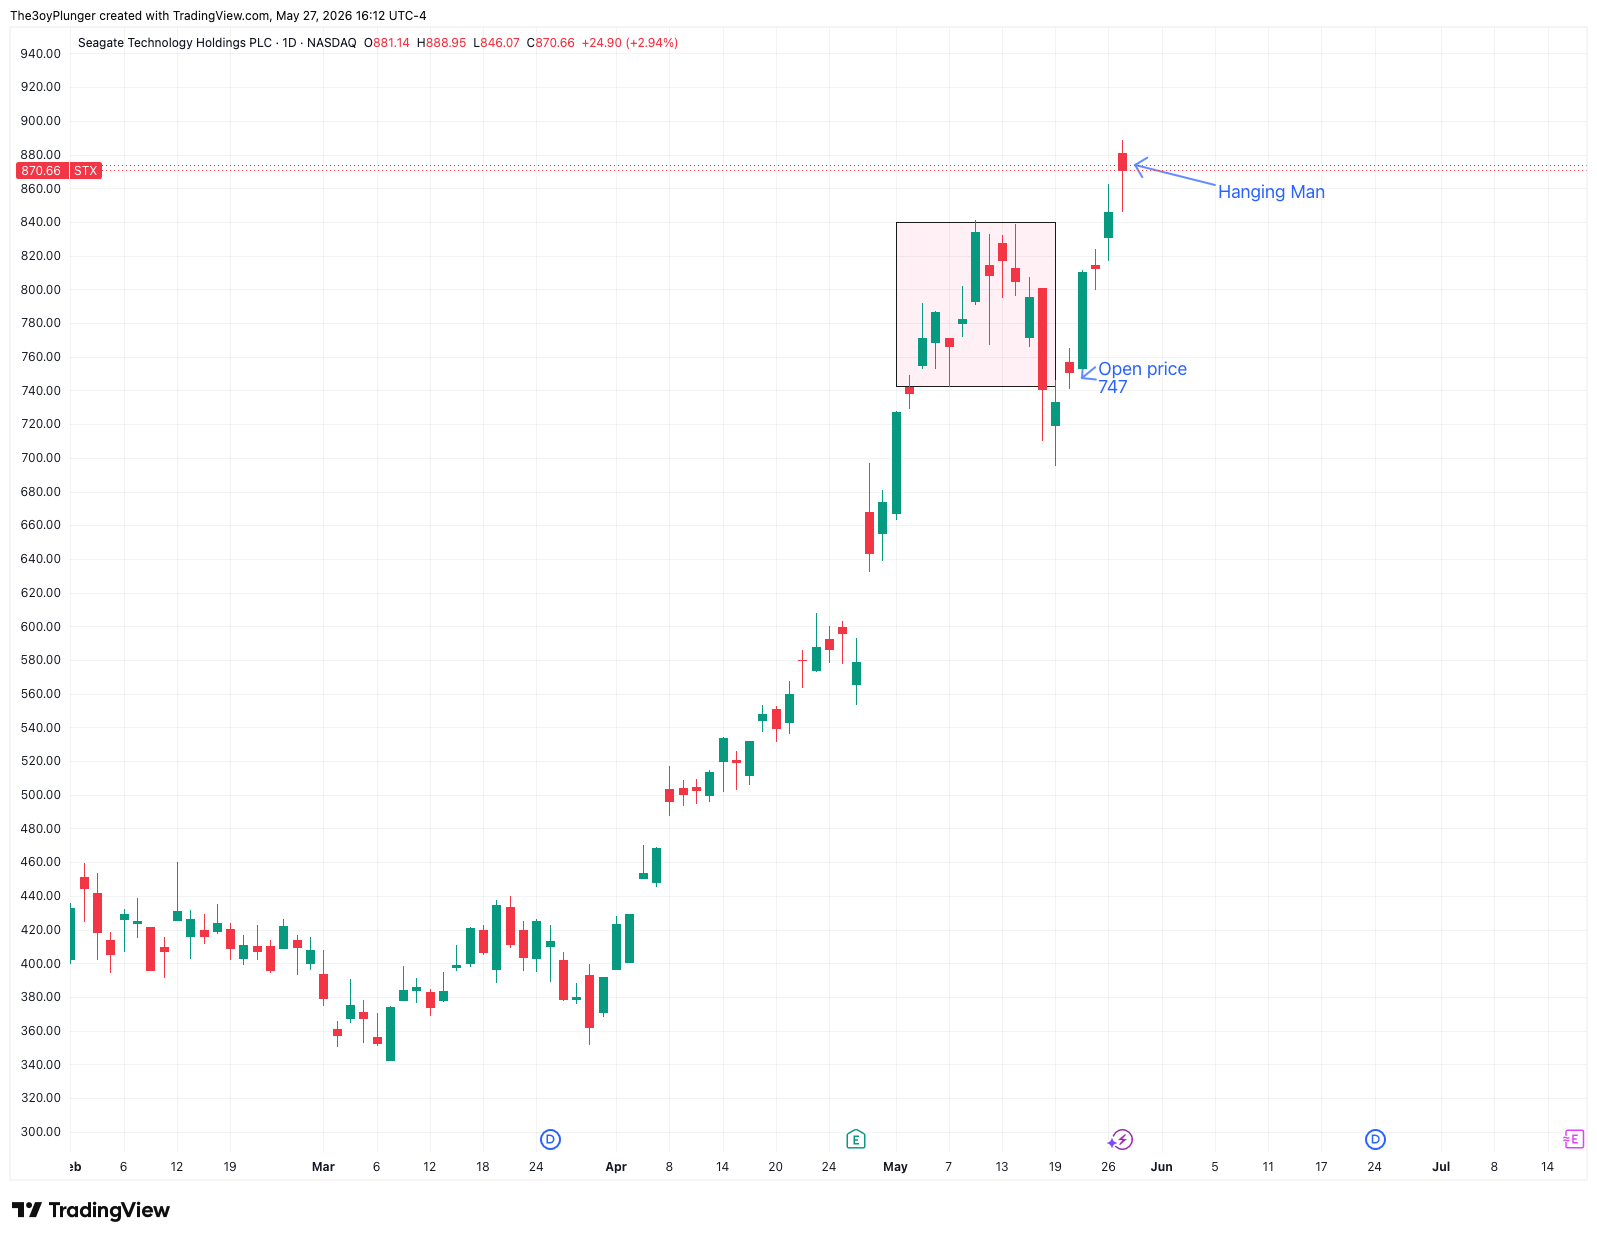
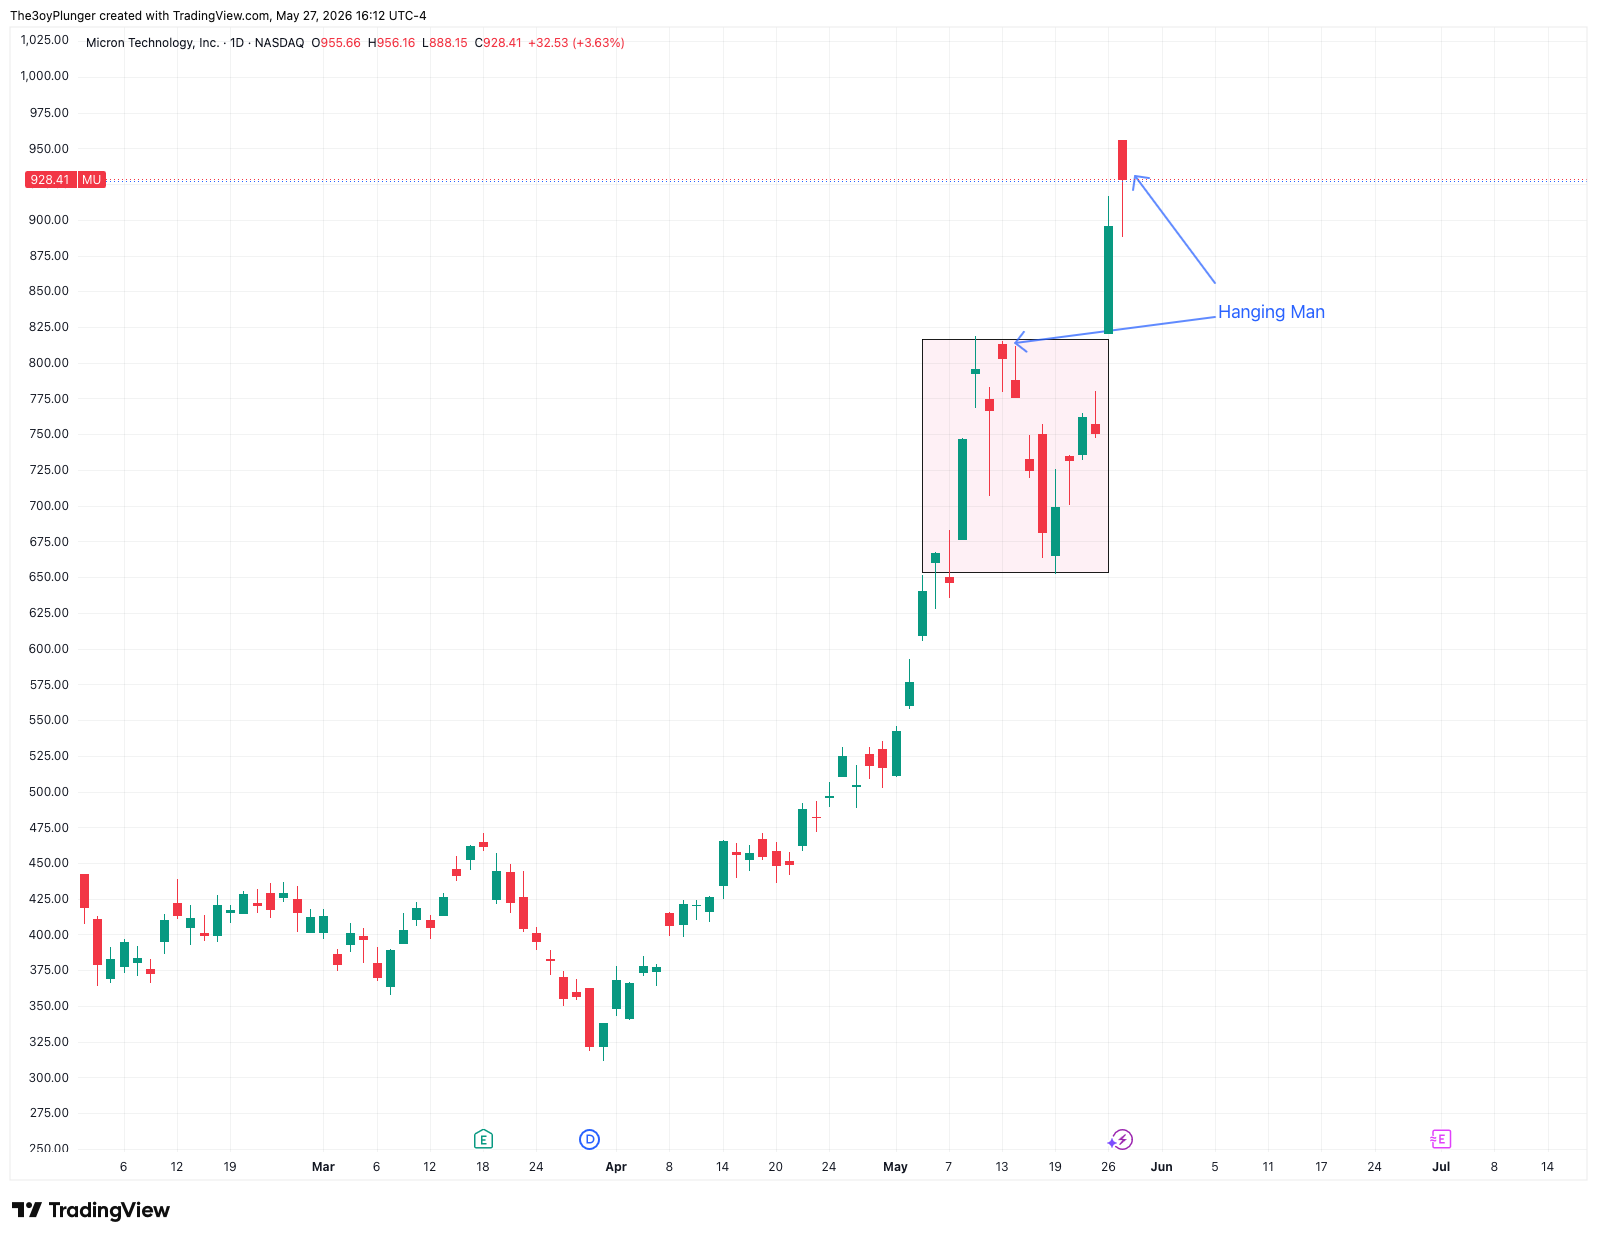
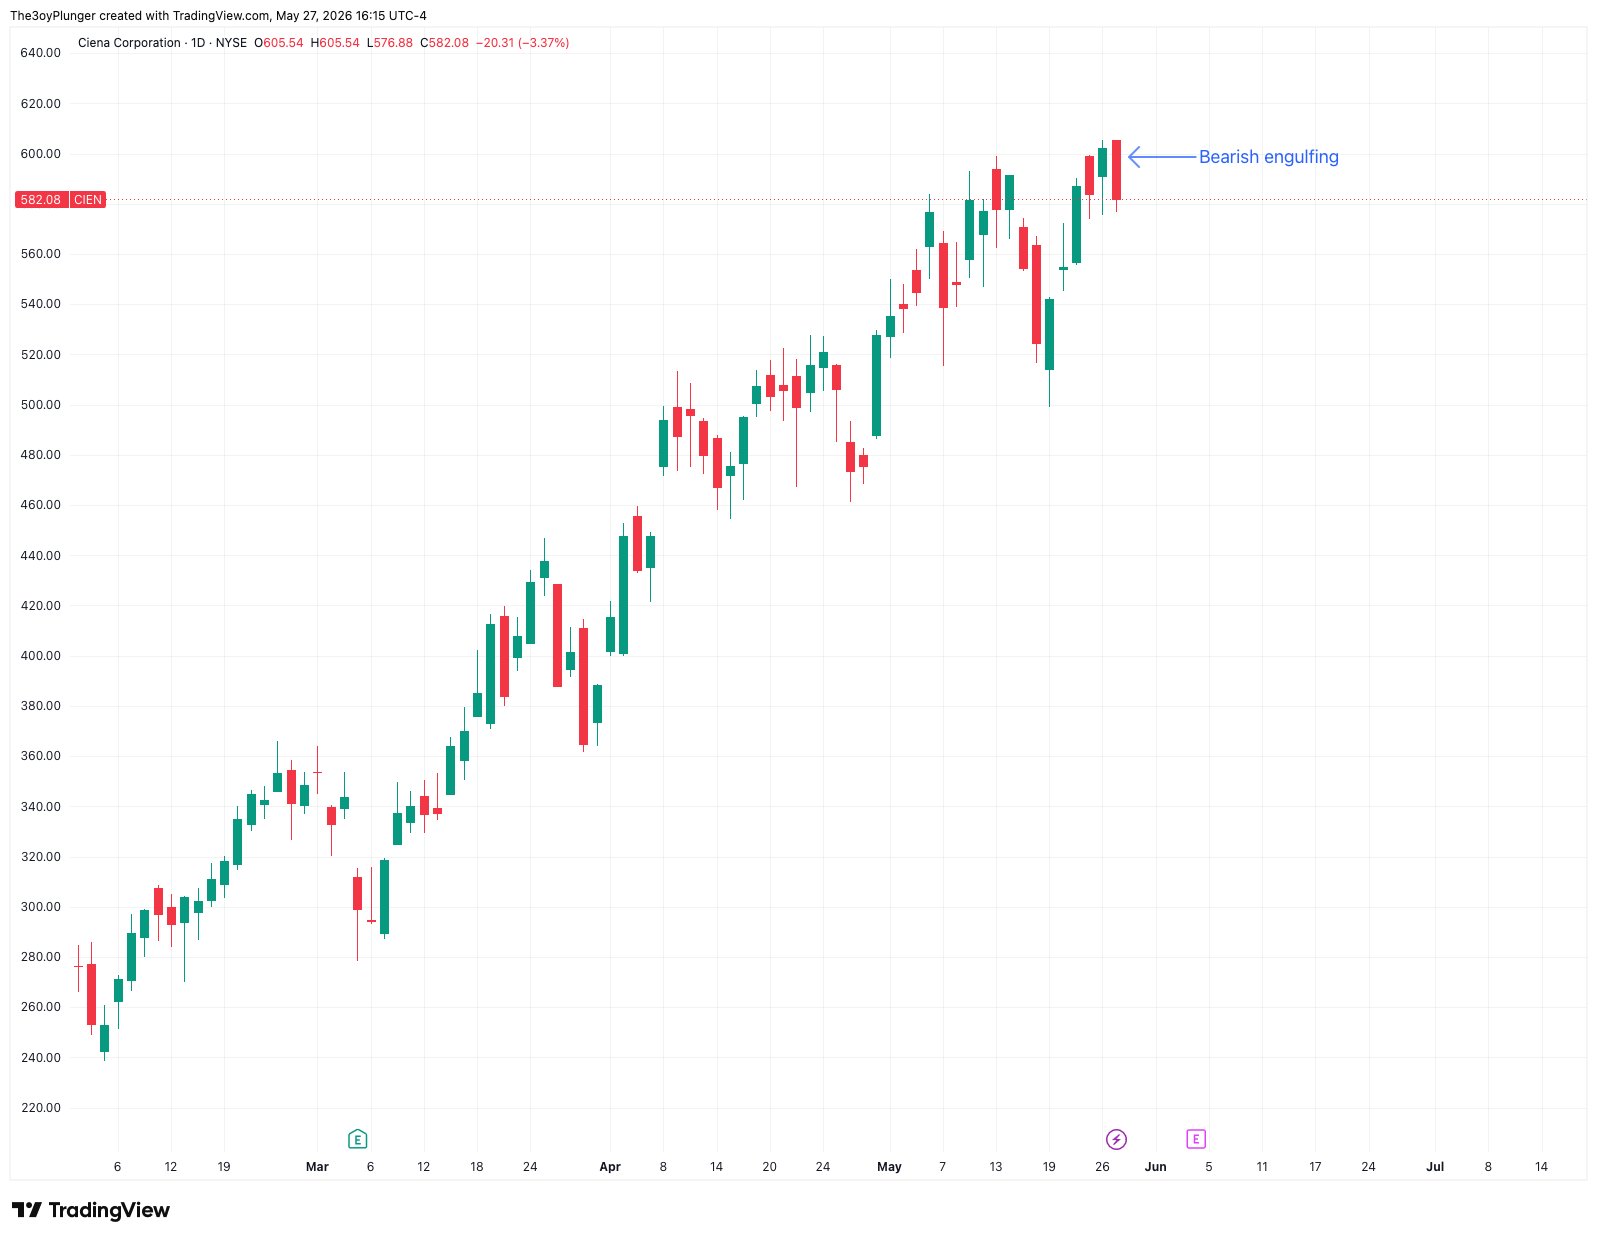
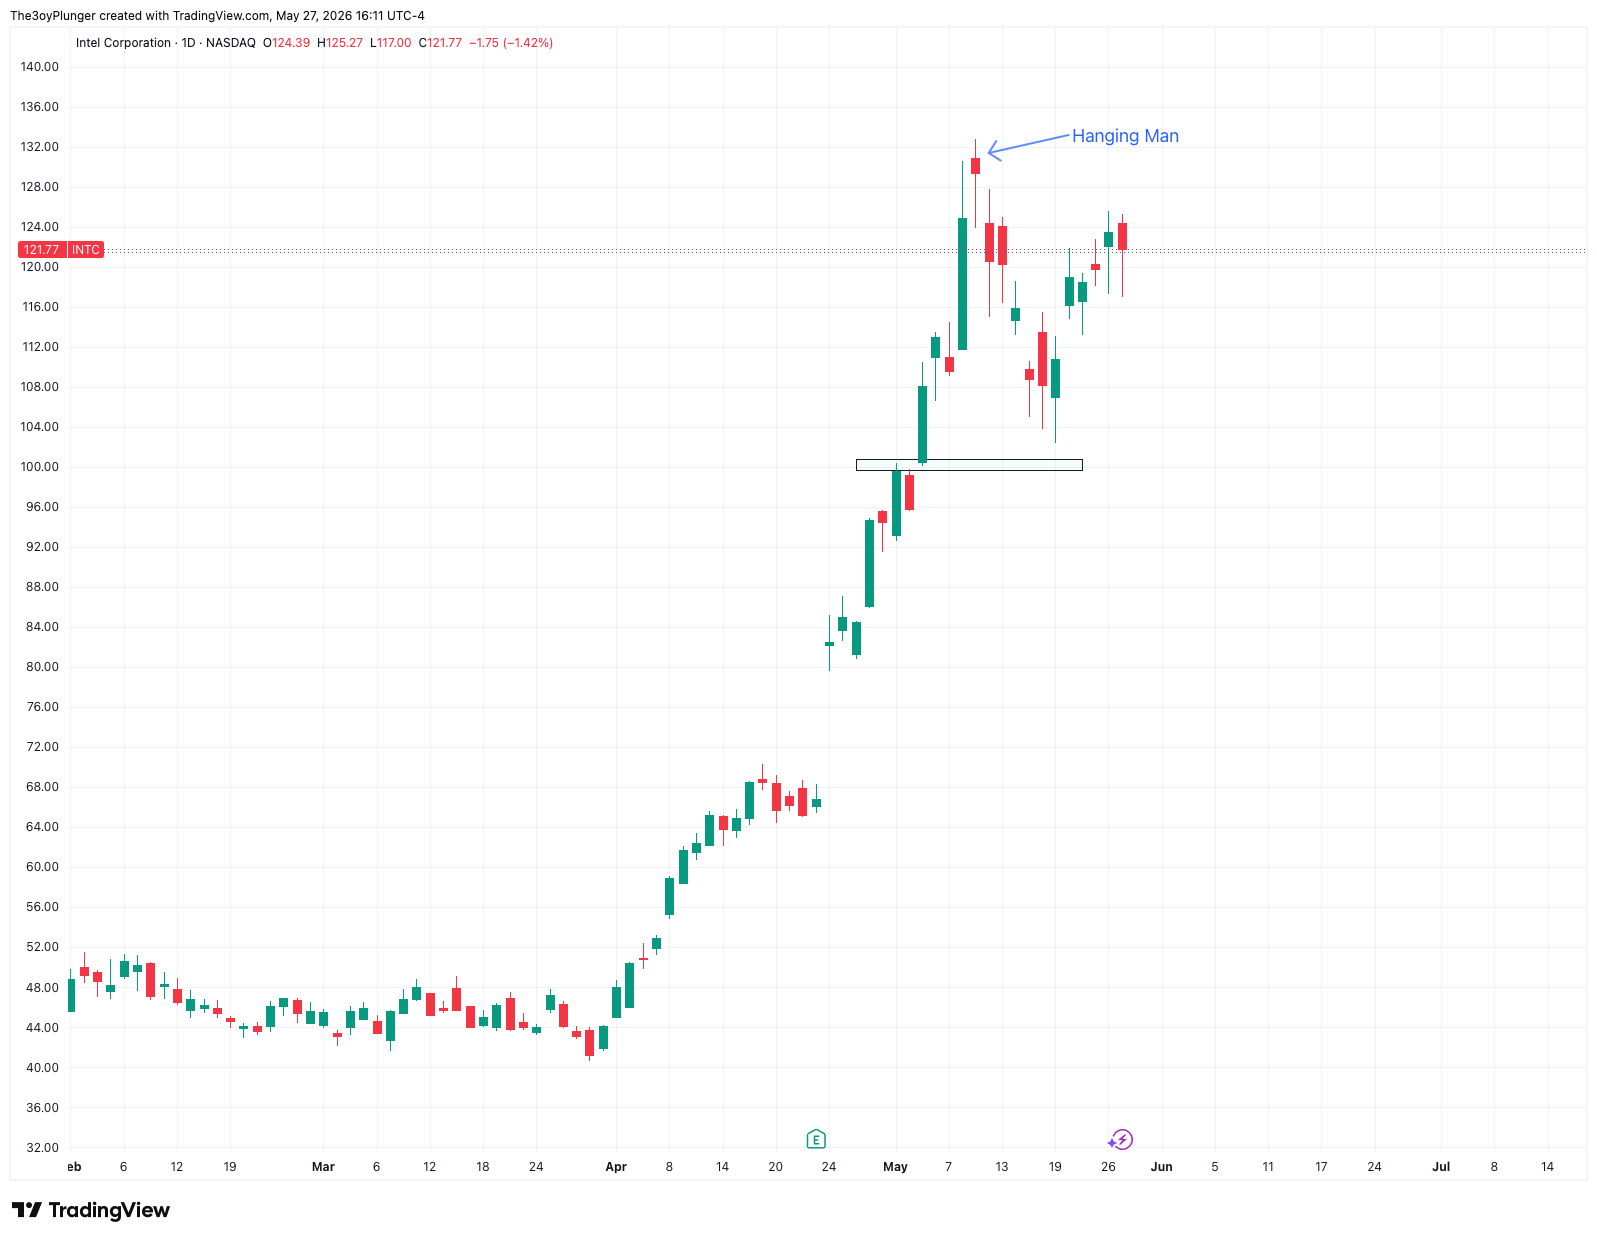
The dominant theme of today's session was the coordinated reversal auctions printing across the year's highest-flying technology and semiconductor leaders.
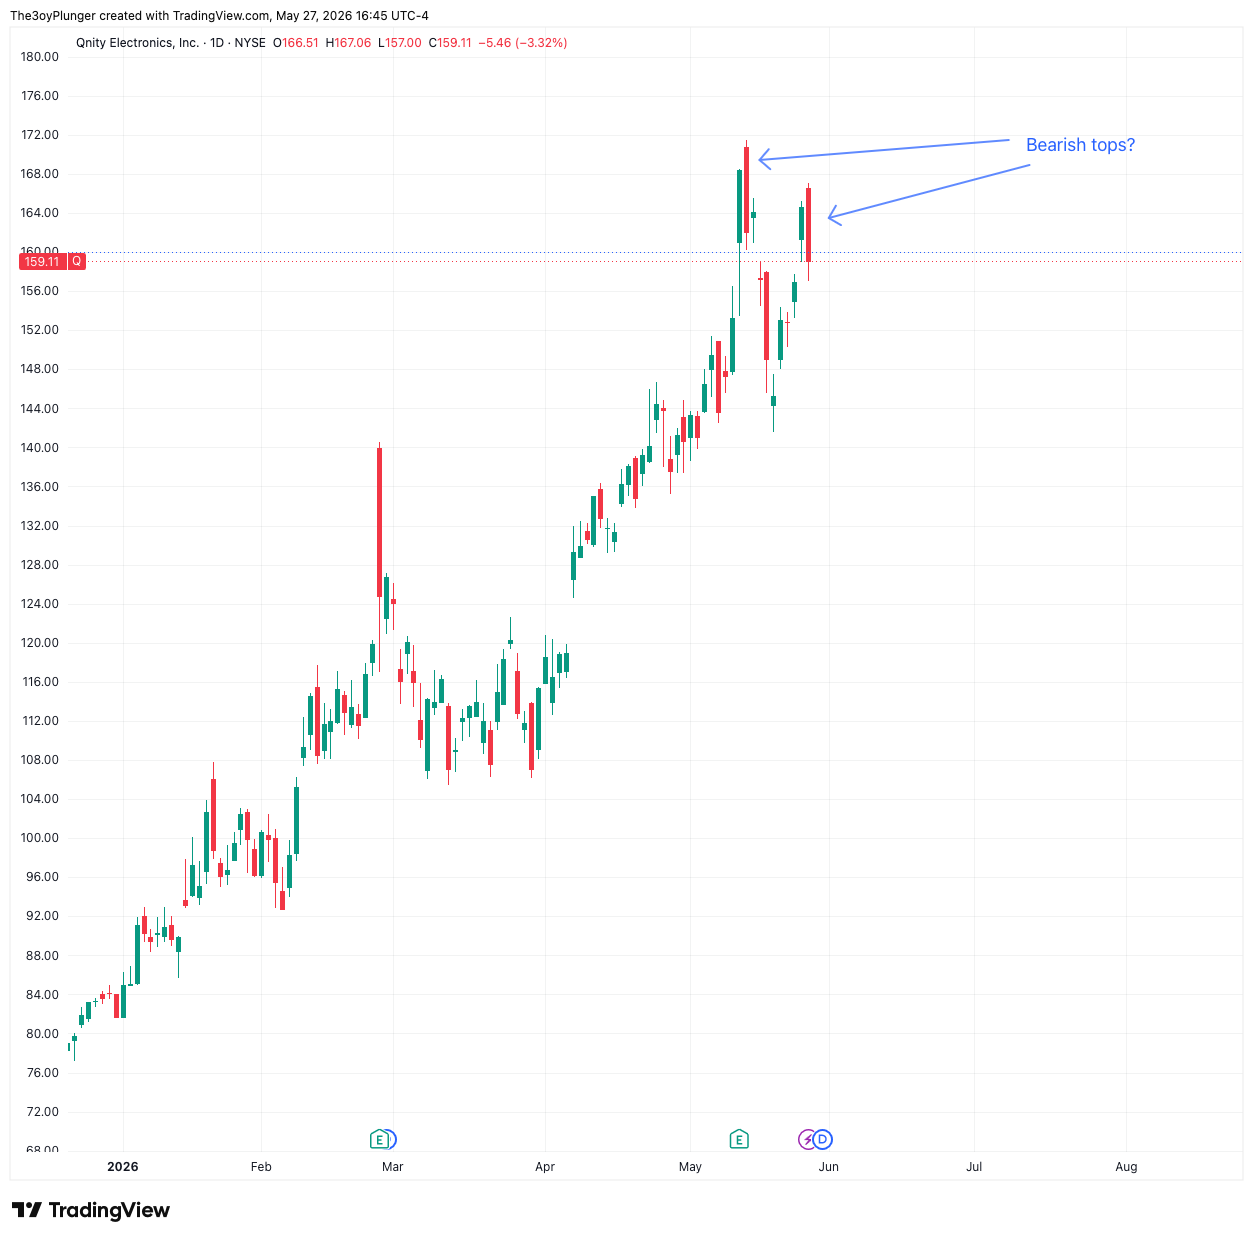
A cluster of premier names—specifically SanDisk ($SNDK), Seagate ($STX), Micron ($MU), Ciena ($CIEN), Western Digital ($WDC), Intel ($INTC), and Qualcomm ($Q)—all advertised sharply higher prices early in the day, only to attract aggressive, motivated responsive sellers. This structural shift forced our desk to proactively execute tactical exits in our core SNDK and STX long campaigns midday to lock in realized gains. We present some charts below that show the weak auction we had today in some of these names.
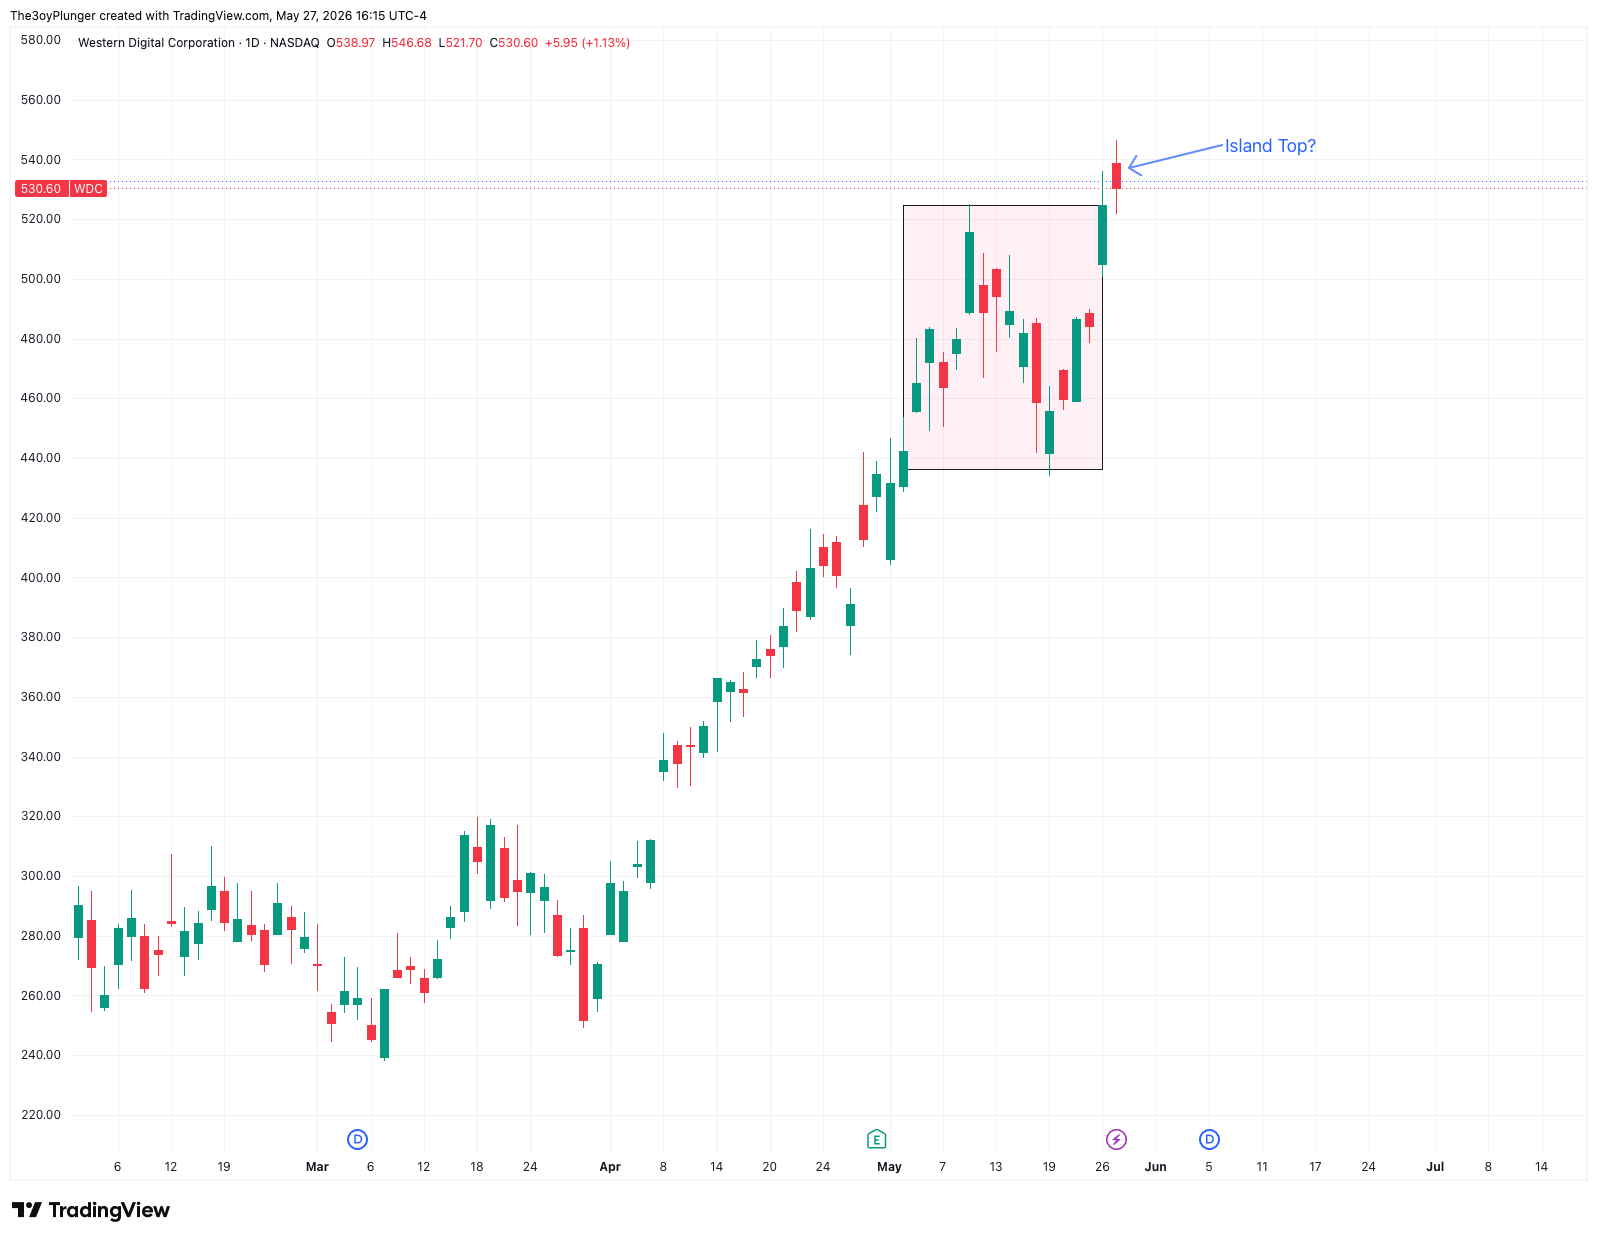
The immediate task for market participants is to watch how these specific relative strength leaders react to today's damage:
- The Trapped Seller Case: If these assets stabilize tomorrow and refuse to break today's cash lows, today's drop will simply be classified as a volatile shakeout within a broader upward value migration.
- The Reversion Case: If tomorrow brings a gap down and continuation below today's low nodes, it confirms that a multi-week balance area is forming, making a deeper mean-reversion move toward lower structural floors highly probable.
3. NVIDIA ($NVDA): Still Anchored to the Floor
While individual hardware names experienced volatile upside rejections, NVIDIA spent the session continuing to consolidate right above its critical support shelf.
As highlighted this morning, the $215.00 node represents the vital pivot point from late April. NVDA was down 1% today and traded as low as $208.68. We continue to monitor this $215.00 boundary closely; Although the 215 level was taken out today we will still monitor NVDA's ability to reclaim or fail over the remaining days of the week. This will likely dictate whether the broader technology sector can absorb today's yellow flags or if a wider market balance area must be carved out.
Required Footnote Disclaimers
Regulatory Compliance Notice: Market Profile Research is an independent publisher of general-interest financial information and technical market commentary. We are not registered investment advisors, financial planners, or broker-dealers with the SEC or any state regulatory body. This commentary does not constitute personalized investment advice, financial planning, or an endorsement or solicitation to buy or sell securities. All content is prepared strictly for educational, informational, and general research purposes under the publisher's exemption.
Risk Disclosure: The market parameters, extreme ranges, and pivotal support zones discussed represent the internal research observations and proprietary tracking models of a private fund. Trading equities and ETFs involves a high degree of risk, including the potential loss of principal capital. Past performance, asset correlations, and breakout models do not guarantee future results. Subscribers are entirely responsible for their own independent financial and risk management decisions.