
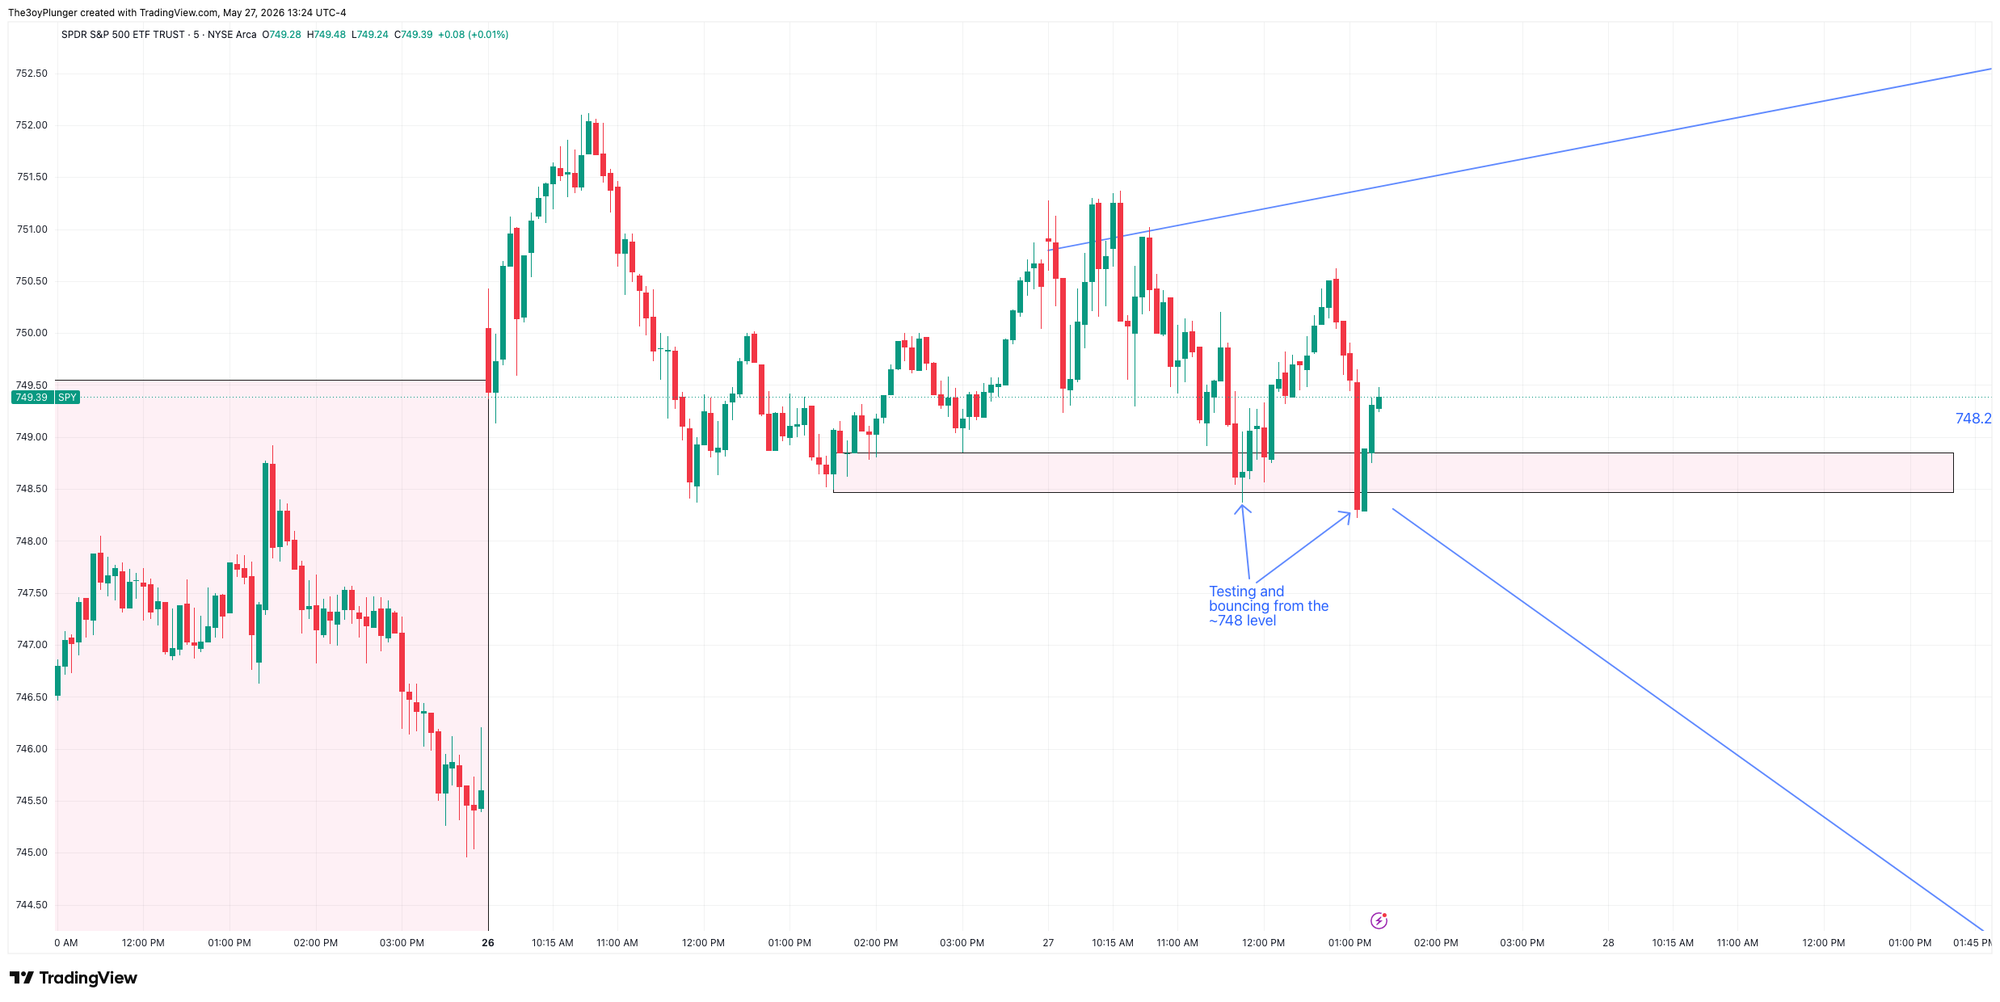
Update 1:23PM:
So far we have tested the 748 level twice and bounced from it. These levels seem to be holding for now.
May 27, 2026 8:00AM
S&P 500 (SPY): Testing the Breakout Threshold
During the May 26 session, the SPY ETF pushed into new all-time highs, printing an intraday peak of $752.13 before settling the auction at $750.59. Critically, this daily close printed just above the previous structural swing high of $749.53 established back on May 14.
To verify whether this breakout is structurally valid or a temporary liquidity probe, we require immediate follow-through. Going into tomorrow's session, confirmation requires price to accept value within today's range or actively expand higher.
Our line in the sand sits at $748.20. A breach below this node indicates that today's local auction lows have been taken out, shifting the near-term probabilities to favor a downward rotation. It is important to emphasize that a drop below this line does not signal the end of the macro bull market. Instead, it indicates that the index is returning to a state of balance within its two known higher-timeframe extremes: $749.53 on the high end and $731.00 on the low end. Markets naturally tend to balance far more than they trend; a rotation back into this range would be standard auction behavior.
NASDAQ 100 (QQQ): Confirmed Value Migration Higher
In contrast to the S&P 500, the QQQ ETF displayed an explicit, high-velocity breakout signal today. The index gapped open at $725.72 and trended smoothly throughout the day to settle at $731.17.
This price action was established entirely outside and above its multi-week balance area, which had been bounded by $695.00 on the floor and $722.00-and-change at the ceiling. The core structural questions facing our desk now are:
- Will we see sustained continuation and institutional acceptance at these higher advertised prices?
- Or will responsive sellers step in and force a mean reversion back into the previous value area?
This tech-driven surge was spearheaded directly by the market's top-performing hardware leaders—specifically SanDisk ($SNDK), Micron ($MU), and Seagate ($STX) etc. Capital is clearly flowing into these relative strength leaders to drive the broader index.
NVIDIA ($NVDA): The Notable Divergence at a Key Pivot
While tech hardware is leading the index, NVIDIA is presenting a notable, decoupled divergence. Since printing its swing high of $236.00 on May 14, the asset has experienced a roughly 12% decline, notably failing to capture its typical post-earnings momentum.
As of early this morning, NVDA is trading directly above a vital historical pivot point at $215.00, which marks the accumulation floor established on April 27 and also November 2025.
Over the coming sessions, our technical focus is strictly anchored to this $215.00 node. We are monitoring two distinct structural paths:
- The Bearish Case: Price fails to hold the floor and rolls back into its April 2026 market profile range, signaling an extended cooling-off cycle for the market leader.
- The Bullish Case: Responsive buyers defend this pivotal point, triggering a tactical bounce back toward yearly highs.
Because of NVIDIA's massive weighting within the indexes, a confirmed technical bounce at this support shelf would provide the necessary structural fuel to sustain the current breakouts in both the NASDAQ and the S&P 500.
Fixed Income & Macro Rates (US Treasury Bonds)
Next, we will look at another major asset class: the long-duration US treasury bonds. Since the escalation of geopolitical conflict in the Middle East in late February, bonds have been trending steadily lower. On May 18, the auction took out the structural lows of both 2024 and 2025.
However, we are still trading above the significant October 2023 lows, which were printed during the peak inflationary period following the start of the Russia-Ukraine war. These structural developments remind us that wars are inherently inflationary—especially when they disrupt crude oil prices. Energy is a major input into every aspect of the economy, affecting everything from everyday transportation and food production to fertilizers and logistics.
From an auction perspective, the traders who went short the bonds on May 18 as they broke to multi-year lows got caught "short in the hole." Any news of potential peace or de-escalation in the Middle East immediately triggered an aggressive short-covering rally.
Looking at the structural trend, bonds are still technically pointing lower and are holding below the previous balance floors made back in March. Going forward, the path we are observing is whether this short-covering rally results in a more prolonged reversal in trend—helping bonds move back toward their yearly highs—or if value is accepted at these lower levels, setting up a retest of those May 18 lows.